Key takeaways
- Macro—We think the fed will cut 25 bps in September and October despite this week’s PPI surprise; Jackson Hole will draw intense scrutiny yet is unlikely to deliver forceful guidance, keeping near-term repricing muted while setting the stage for fall easing.
- Flows and rotation—ETH continues to lead while signs points to an altseason. ETH breaks to 2021 highs as top DATs add >2% supply alongside $2.27B in spot ETF inflows; Q2 13F patterns imply retail-led demand despite more institutional holders; BTC dominance down ~9% since July validates rotation, while Circle’s Arc and Stripe’s Tempo L1s target stablecoin rails where lasting share will be won by utility and cost advantage—not branding.
Market View
Given the persistent uncertainty surrounding key economic indicators, the Federal Reserve has thus far maintained a cautious stance on interest rate cuts:
- The recent US Producer Price Index (PPI) for July doesn’t make that any easier. PPI significantly exceeded expectations at 3.3% YoY (vs a median 2.5% survey forecast), suggesting the Fed could take a more measured approach to monetary policy.
- What’s less clear is whether these BLS figures are being affected by tariffs as PPI tends to focus on domestic production and not imports. The US CPI print published earlier this week (2.7% YoY headline and 3.1% core) had little to say on this front, reflecting minimal tariff impact.
- Nevertheless, because of the PPI data, market players seem to be reacting to the possibility of more persistent inflation, and thus reducing the likelihood of immediate rate cuts priced into Fed funds futures.
- We acknowledge that the hotter-than-expected PPI could indicate an uptick in service sector prices, but the components of the PPI that feed into the Personal Consumption Expenditures (PCE) price index, the Fed’s preferred measure of inflation, remain relatively subdued.
- Thus, we see this as an opportunity. We think the Fed’s eventual focus on the broader economic picture, including the labor market, will ultimately lead to 25bps rate cuts in September and October. A non-consensus rate cut increases the likelihood of our constructive crypto view being realized.
Meanwhile, ETH’s rally remains a key market focus, after breaching its highest levels against USD since 2021. Against peers, the ETH/BTC cross has more than doubled from the lows reached in late April 2025 (0.0187) but it remains far below the peak of 0.0872 from December 2021.
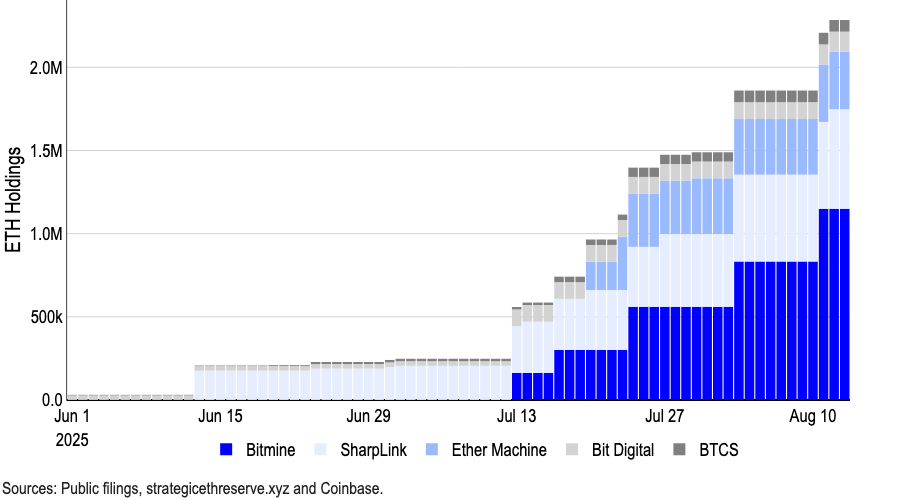
- As we mentioned in our Monthly Outlook, much of the recent ETH activity has been driven by demand from digital asset treasuries (DATs). Since the start of August, the top ETH DATs have purchased over 795k ETH (US$3.6B) as these entities now control over 2% of the total ETH supply. Given the difference in ETH vs BTC trading volumes on centralized exchanges, the price impact of $3.6B in net buying flows is significantly higher than for BTC. (See Chart 1.)
-
Spot ETH ETF inflows have also been massive this week. For just the period of August 11 to 13, these vehicles have attracted $2.27B in net new cash, though the CME futures basis has also climbed from 7.4% (annualized) last week to 10.4% this week. That is, we don’t yet have the data on leveraged funds’ short positions (due today at 3pm ET), which may show that at least some of these inflows may be hedged by short ETH futures positions.
Chart 1. ETH held by select digital asset treasury companies
More retail buyers of ETFs
- The deadline for 13-F filings (2Q25) was yesterday (August 14) for all firms managing more than $100M. Interestingly, the latest data shows that the share of spot ETH ETFs’ institutional holders declined from 39% to 33% last quarter even though the number of entities increased to 981, based on Bloomberg data. Indeed, not only did institutional participants increase their number of shares held, but 1Q25 had net outflows of $254M versus 2Q25’s $1.8B in net inflows. With hedge funds (who often use ETFs for basis trading) keeping their participation near 7% of the total value, this suggests retail buyers were actually the big contributors to last quarter’s flows.
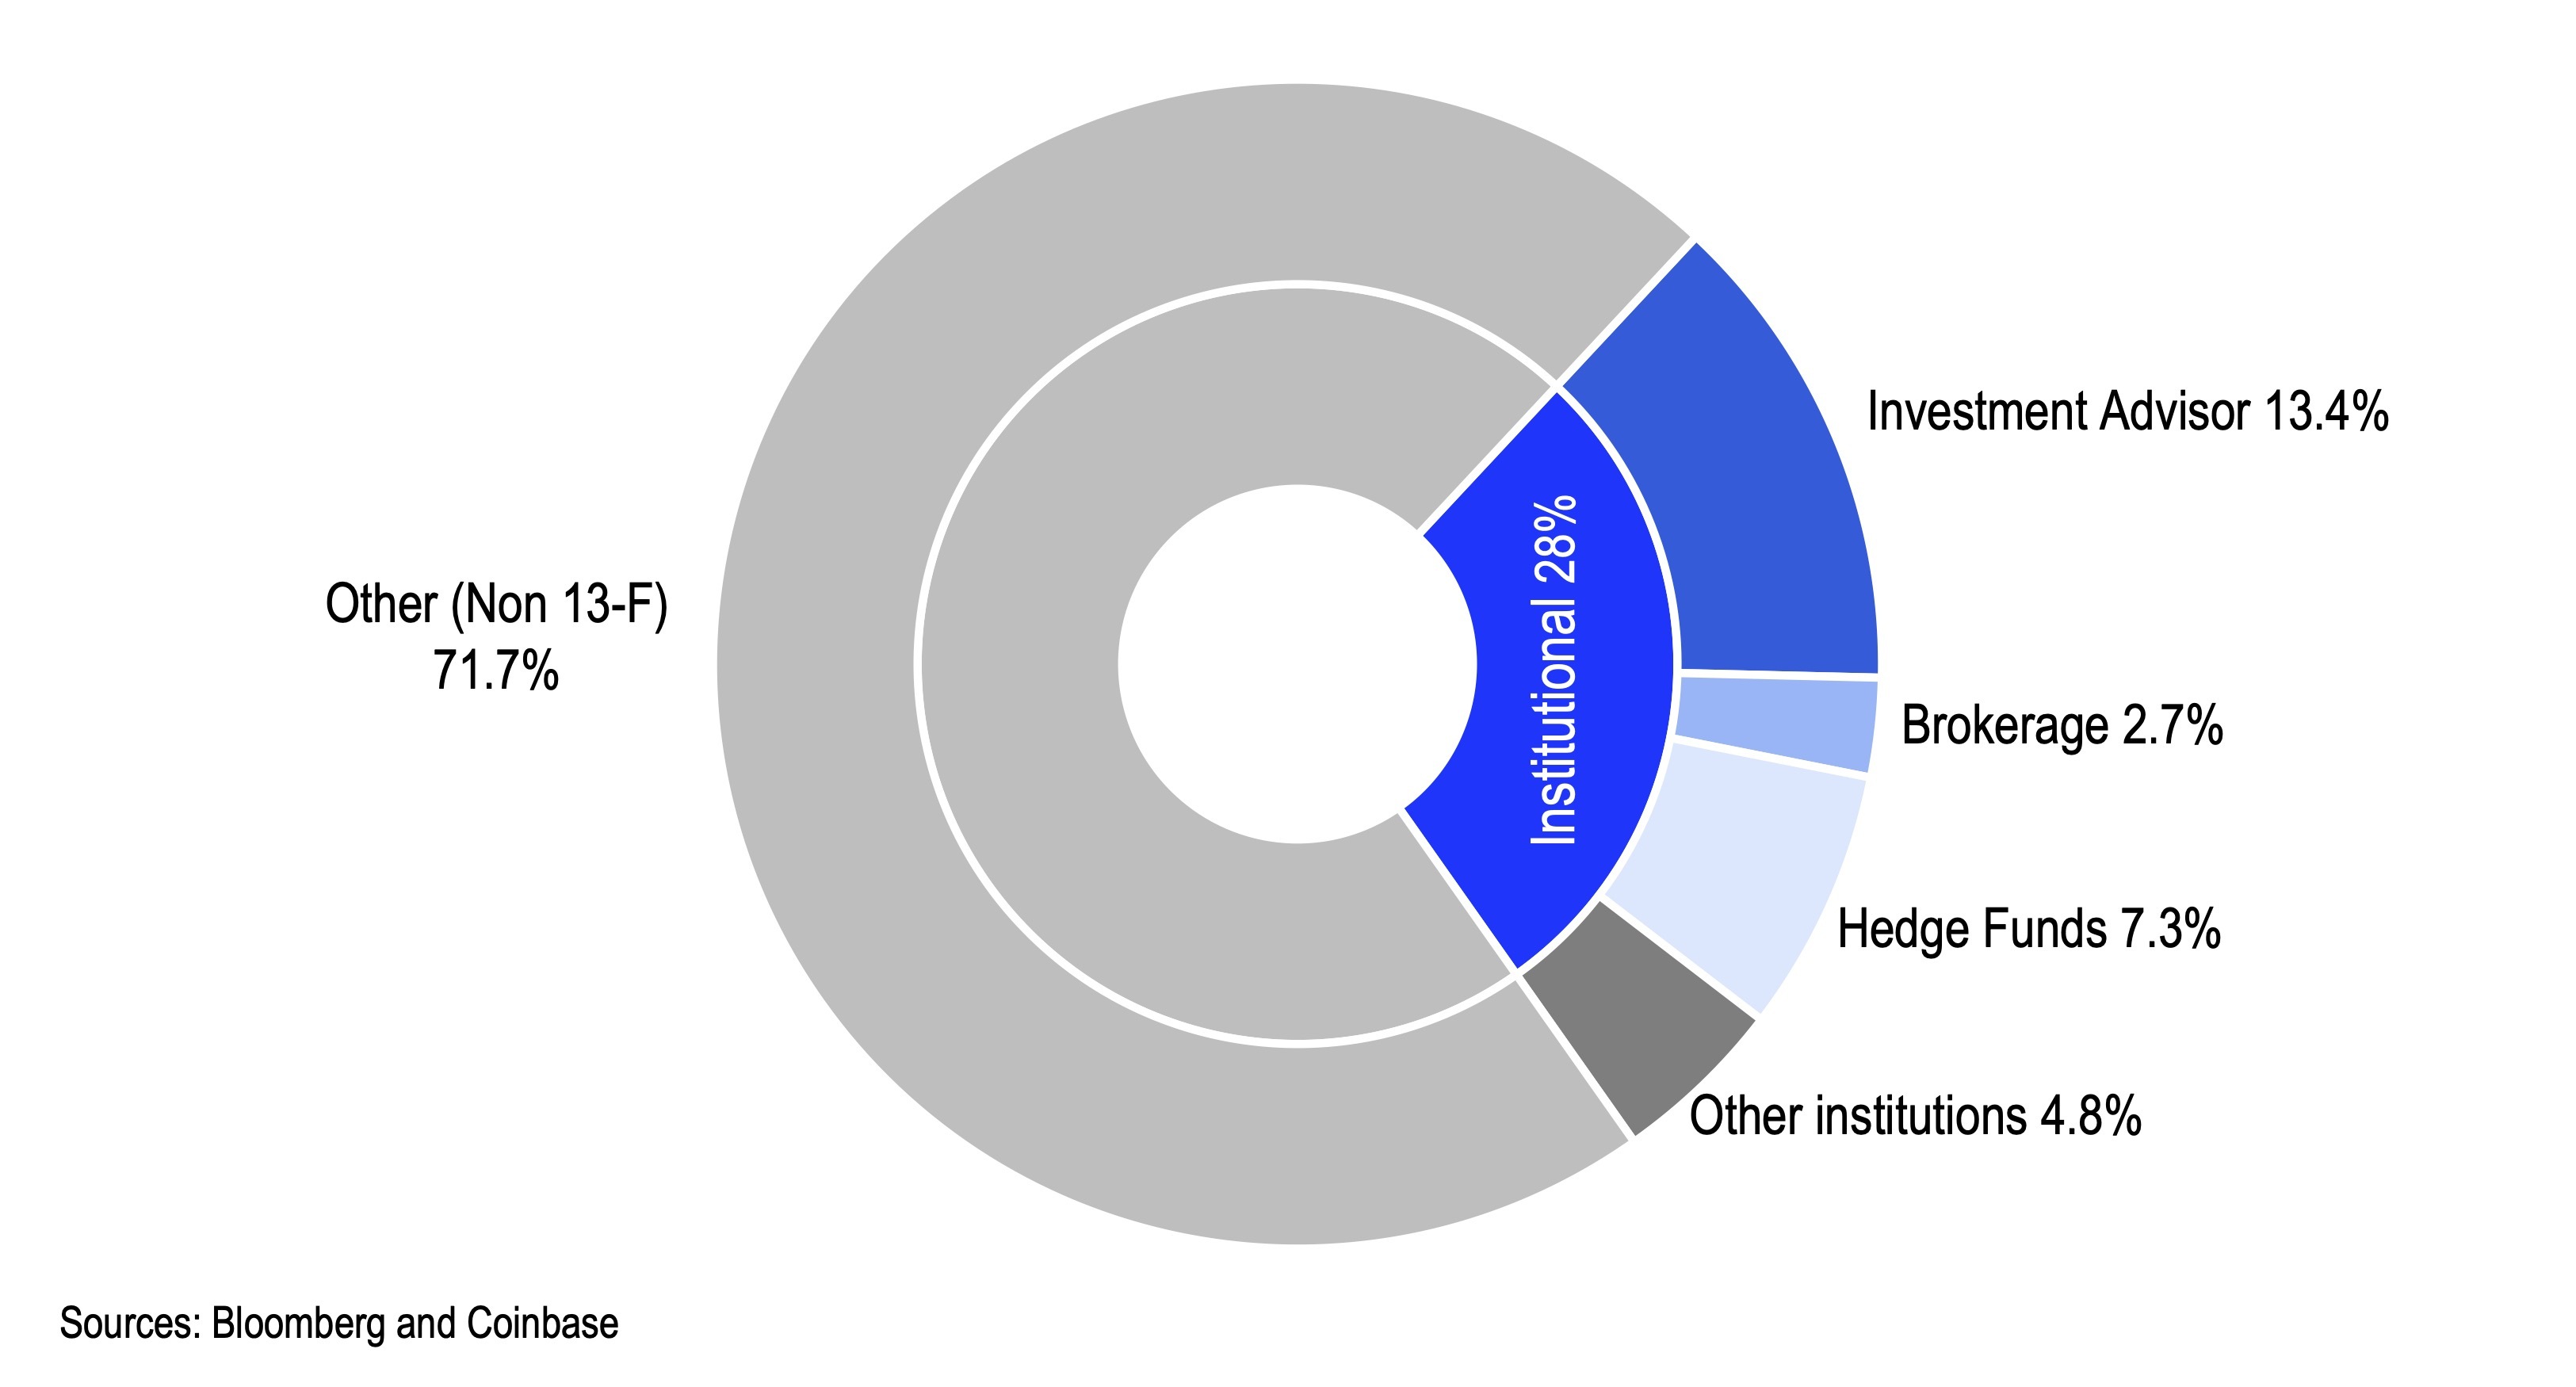
- We saw something similar for spot BTC ETFs, as the number of institutional holders increased by 312 but their share of the pie decreased to 28%. Hedge funds increased their position both in the number of ETF shares as well as their value (from $7.7B to $9.8B), but they now hold only 7.3% (down from 8.3%) of the total BTC ETF market cap. Again, this suggests retail buyers were behind the massive $12.8B in net BTC ETF inflows last quarter.
Chart 2. Institutional Holders of Spot BTC ETFs (Based on 2Q25 13-F filings)
Alt szn?
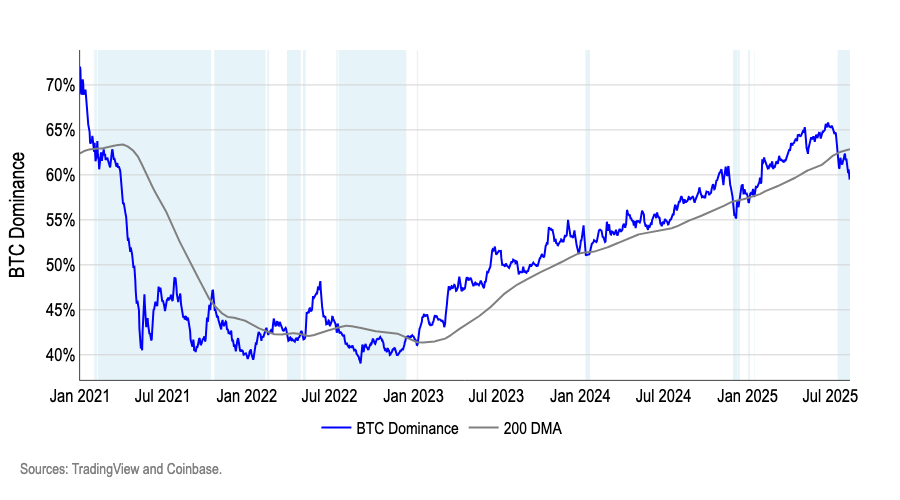
- The BTC-dominance breakdown weflagged last month has followed through—down ~9% since July—validating the rotation signal and ushering in broad altcoin outperformance. Last month, we noted BTC dominance closing below its 200-day moving average (DMA) for the first time since January and advised waiting for confirmation. That confirmation arrived: dominance remained below the 200-DMA and has since extended lower by ~9% since July, consistent with past “alt-season” phases in which higher-beta assets lead for multiple weeks (Chart 3). We think this rotation may continue to persist assuming we receive a rate cut in September.
Chart 3: BTC dominance continues to trade below its 200 DMA
-
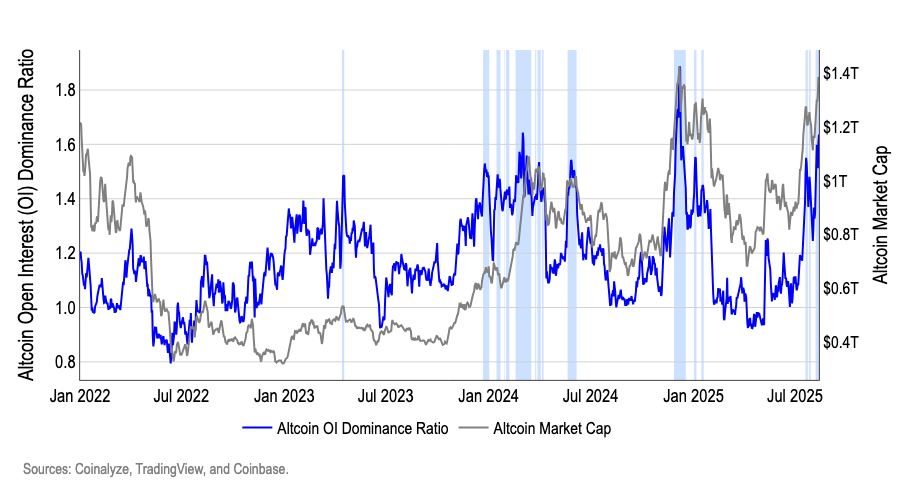
Altcoin OI dominance again telegraphed this week’s de-leveraging event. Wepreviously noted that the Altcoin Open-Interest Dominance Ratio (alt OI ÷ BTC OI) becomes precarious above ~1.4, with last month’s jump to ~1.6 preceding broad forced unwinds. The same setup reappeared this week: the ratio climbed back above 1.6, signaling leverage crowding in alt perps relative to BTC (Chart 4). Upon the PPI release, we witnessed a broad deleveraging event across crypto assets. We think this reinforces the ratio as a practical early-warning gauge: a sustained drift down toward ~1.2–1.3 would indicate orderly de-risking and healthier conditions for a renewed alt advance, while persistence >1.4 leaves the tape vulnerable to additional shake-outs.
Chart 4: Altcoin open interest dominance spiked above 1.6 this week
Circle and Stripe L1s: Implications for Ethereum and Solana
- Circle and Stripe announced plans to launch L1s, primarily to support stablecoin payments. Circle has announced Arc—an EVM-compatible L1 with USDC as native gas, deterministic sub-second finality (Malachite), and a built-in stablecoin FX engine aimed at cross-border settlement and B2B flows. Timelines point to public testnet before mainnet beta in 2026. Stripe is reported to be developing an EVM-compatible payments L1 ( “Tempo”) focused on merchant checkout and high volume payment processing; we think its initial emphasis would be USDC given Stripe’s existing stablecoin rails.
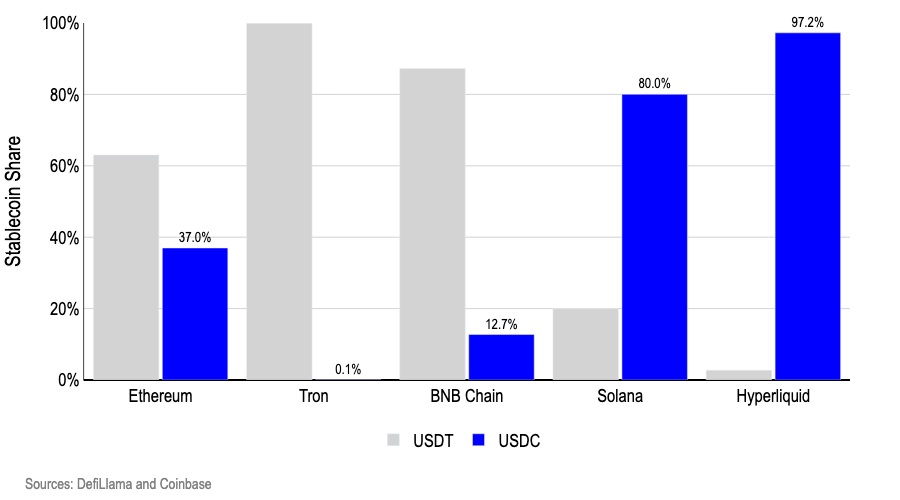
- We think Solana may be structurally more vulnerable to USDC migration than Ethereum. Solana’s stablecoin base is USDC-heavy (~80% USDC / ~20% USDT), whereas Ethereum’s is USDT-led (~37% USDC / ~63% USDT) (Chart 5). Beyond this mix, we think Solana’s core value proposition—payments-grade speed, high TPS, and low fees—overlaps directly with what USDC-native, payments-optimized L1s like Arc & Tempo are designed to offer.
- If USDC settlement concentrates on those rails, it is a like-for-like substitute for the type of flows that currently favor Solana, making payments throughput easier to reroute off Solana. By contrast, Ethereum L1’s higher fees/latency mean onchain payments already gravitate to L2s or off-chain processors, while Ethereum’s more diversified, USDT-anchored base and RWA/DeFi collateral usage are less sensitive to a USDC-specific payments shift.
Chart 5: USDC dominates stablecoin share on Solana but accounts for less than half of Ethereum
-
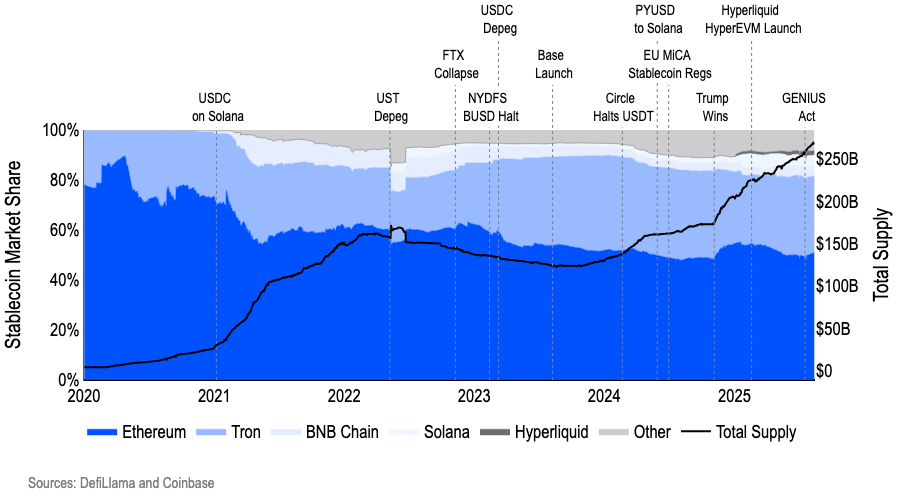
We think historical analogs suggest that durable market-share rotations follow shifts in comparative advantage, not branding. That lens implies Arc & Tempo may pressure Solana more than Ethereum, in our view. The biggest inflections in stablecoin market share line up with events that reinforced a chain’s edge: ETH’s share climbed upon Trump winning the 2024 presidential election due to renewed vigor in institutional and RWA narratives which favored Ethereum’s security and compliance posture (Chart 6).
- In early 2021, Solana attracted stablecoin share when it delivered what Ethereum couldn’t—high TPS and very low fees. However, future L1 launches didn’t notably change the feature frontier and thus had little visible impact on stablecoin distribution. We think Arc and Tempo compete where Solana’s advantage sits—high-throughput, low-fee USDC payments—so if merchant/wallet routing shifts to those USDC-native rails, the incremental flow may come out of Solana’s retail payments activity first, with Ethereum’s broader, institution-leaning base less affected in the near term.
Chart 6: Stablecoin market share by chain