Key takeaways
- Global liquidity is rising and a September Fed cut appears forthcoming, offering fresh risk-on fuel even as payroll revisions, PMI figures and tariff concerns flag softer growth.
- Q2 earnings price action shows tempered risk appetite, yet credit spreads, stablecoin issuance and bitcoin fundamentals show underlying sentiment remains constructive long-term.
- Bitcoin’s onchain picture—85% held by long-term wallets, shrinking exchange balances, MVRV ≈2.5 and Puell ≈1.3—signals limited sell pressure and room for further upside once macro jitters ease.
Summary
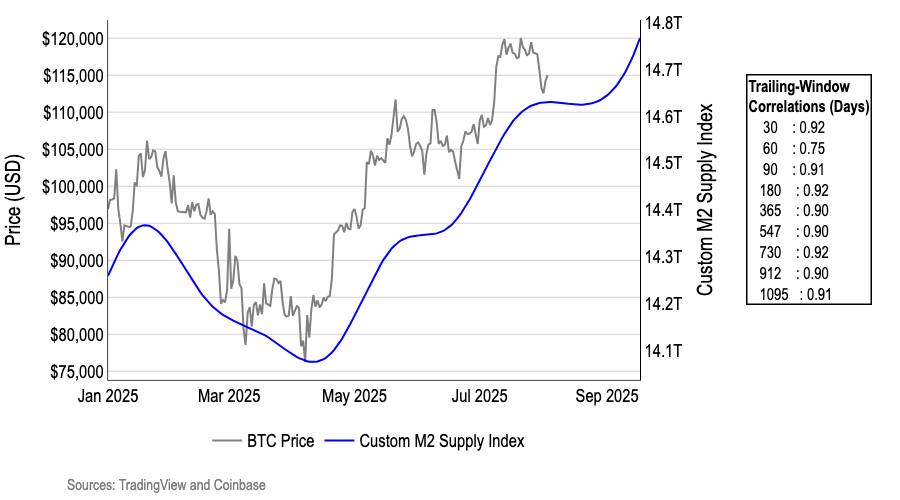
- Global liquidity and policy still favor risk-on for bitcoin. Our custom M2 index—which is up ~5% since April and leads BTC by 110 days—is at a cycle high, while September rate-cut odds sit near 80%. We think liquidity expansion should outweigh near-term growth scares for the long-term.
- Macro data show cracks, but they likely hasten rather than derail easing. Sub-50 PMI and a net negative 1M cumulative job revision since 2022 signal slowdown; we think this gives the Fed cover for measured cuts that cushion demand.
- Market sentiment is selective in the short term but constructive in the long term. Investors have punished Q2 equity earnings misses 2x harder than usual while a DXY spike plus slump in the copper/gold ratio flag caution. But we believe that tight HY spreads and rising stablecoin supply indicate risk appetite remains intact once the tariff shock and employment fears pass.
- Onchain metrics point to a healthy foundation for BTC. The following factors pave the road for more upside by late Q3/early Q4: MVRV of 2.5, Puell of 1.3, SOPR > 1, 85% of supply held by long-term wallets, persistent exchange outflows, and limited sell pressure.
Macro liquidity and the cost of capital
Our custom Global M2 Liquidity Index—an optimized blend of money-supply growth that leads bitcoin by 110 days—curls higher, pointing to a fresh wave of risk-on fuel for BTC by early Q4 even as current macro headlines remain mixed. The index, an optimized blend of M2 trends in eight major economies – weighted for their signal power rather than sheer size – has risen ~5% since April and now sits at a new cycle high. Because the gauge offers ~0.9 correlation with BTC’s moves across most look-back windows from one month to three years, that acceleration points to additional risk-on fuel arriving in late Q3/early Q4 (Chart 1).
The construction matters: we think weights should reflect the reality that marginal liquidity in more “crypto-active” markets often finds its way into digital assets faster. Monthly M2 prints are interpolated into a daily series, FX-translated into dollars, and then shifted forward by the “lead time” that maximizes the harmonic mean of correlations across nine look-back windows—from one month to three years—so the gauge forecasts rather than merely describes price action. However, policy shocks or structural breaks could erode the linkage, so treat M2 as a directional gauge rather than a precise forecasting tool, especially for long-range projections. For now, we think pullbacks are more likely to be pauses within a broader risk-on trend than the start of a sustained risk-off phase.
Chart 1. Custom M2 supply index forecasts a period of chop before the next leg up by late Q3/early Q4
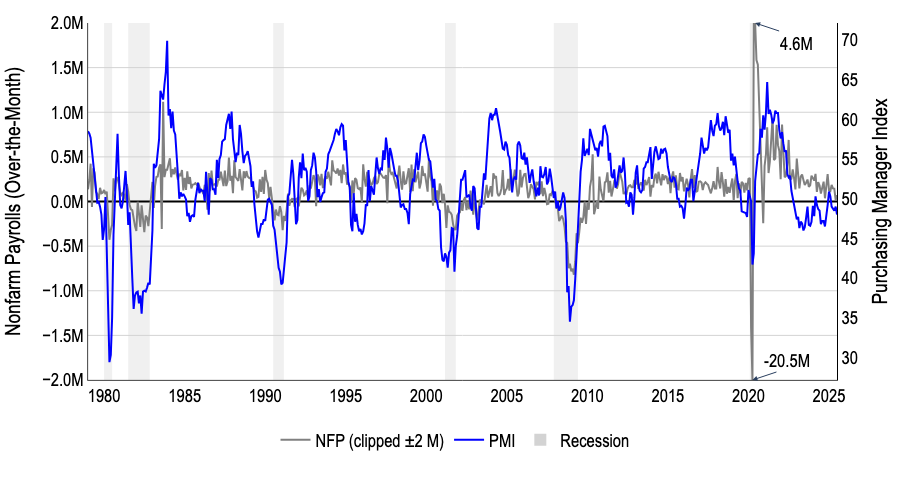
Downward revisions in nonfarm payrolls have quietly cut 1.1M jobs from initial estimates since Jan 2022, which coupled with a sub-50 PMI, likely flags Fed cuts in September, in our view: July 2025’s payroll report showed only 73k new jobs versus ~106k expected, while the prior two months were revised down by ~253K. When you aggregate every monthly back-adjustment since early 2022, the net loss reaches about 1.1M jobs. This weakness is obscured from headline watchers who focus solely on first prints (Chart 2). The labor softness is mirrored in industrial survey data: July’s ISM Manufacturing PMI slipped to 48.0 (from 49.0), below the 50-point neutral level and marking the fifth straight contractionary month (Chart 3). Historically, this combination of stagnating employment and sub-50 PMI tend to precede economic downturns, raising the probability for a rate cut at the next FOMC meeting (Chart 4). (We may know more after the Jackson Hole Economic Symposium on August 21-23.)
Chart 2. Payroll revisions have quietly deleted 1.1M jobs since 2022
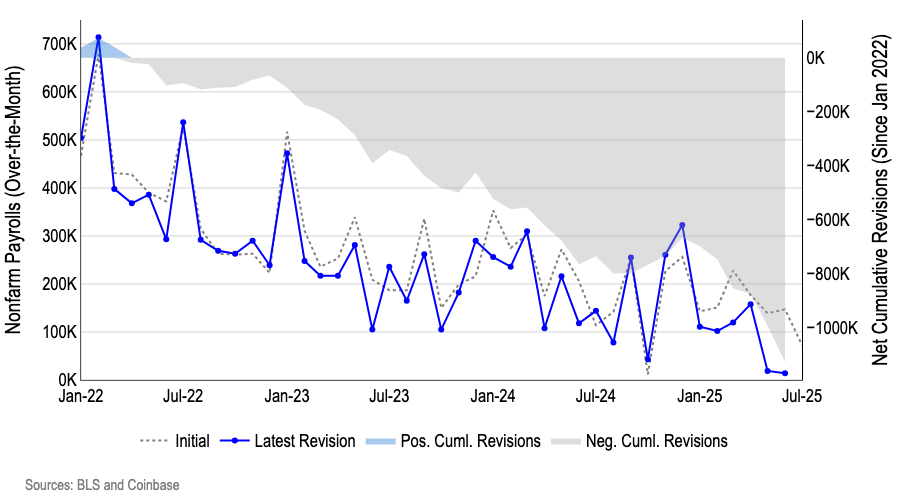
Chart 3. Manufacturing PMI spent most of the past two years below the 50-point neutral level
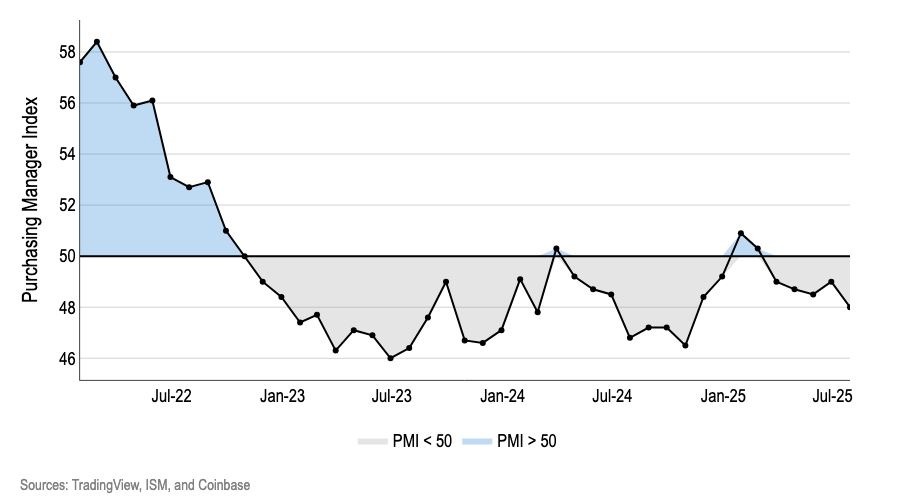
Chart 4. NFP and PMI vs prior recessions
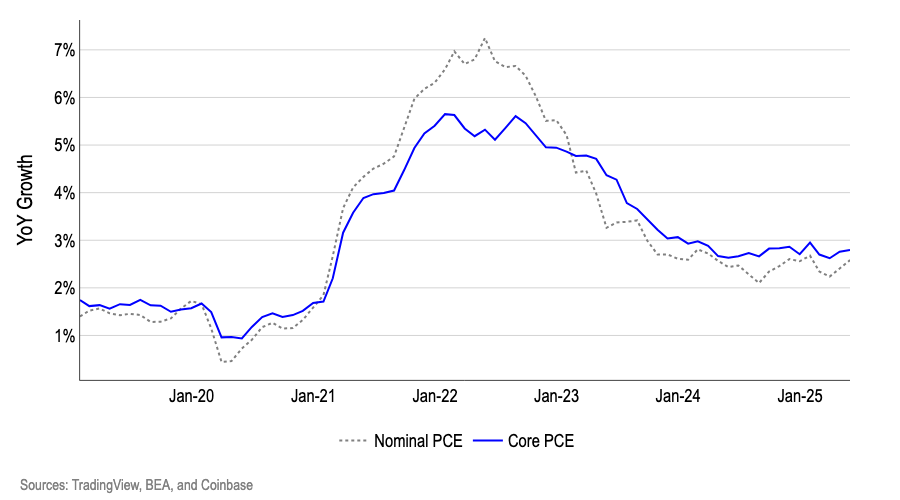
Fed fund futures now bet on a swift Fed cut – pricing an 80% chance of a September cut of 25bps – even as core PCE has graduated higher from 2.6% YoY in April to 2.8% in June (Chart 5). On the one hand, tariff-driven price pressures—a short term 1.8% boost to consumer prices that shaves roughly ~$2.4K off real household incomes (Yale Budget Lab)—risk keeping headline inflation sticky (Chart 6). That could limit how far or how fast the Fed feels comfortable easing, especially if longer-term inflation expectations show any sign of drifting higher.
On the other hand, most of the price bump is cost-push rather than demand-pull, giving policymakers some scope to look past it while addressing clear signs of cooling activity. A measured insurance cut could therefore cushion the slowdown and offset part of the household hit by lowering debt-service costs, while keeping the Fed on track toward its 2% inflation goal.
Crucially for our current assessment, the likelihood of a September rate cut appears to carry more weight than other macro inputs, largely because of how the market responded to the latest payrolls data. The sizable downside revision to jobs growth was followed by bitcoin closing below what had previously been a well-defended lower-time-frame support near $116K. That sequence suggests monetary-policy expectations are exerting an outsized influence for now.
If the Fed does reduce rates in September, we think the policy shift could provide a helpful tail-wind—bolstering bitcoin with an upward bias. However, should the FOMC opt to leave rates unchanged, we think bitcoin may struggle to hold higher-time-frame support, and a clear breakdown could tilt the broader market structure more cautiously bearish.
Chart 5. Markets now assign an 80% chance of a 25 bp Fed cut after weak payroll data
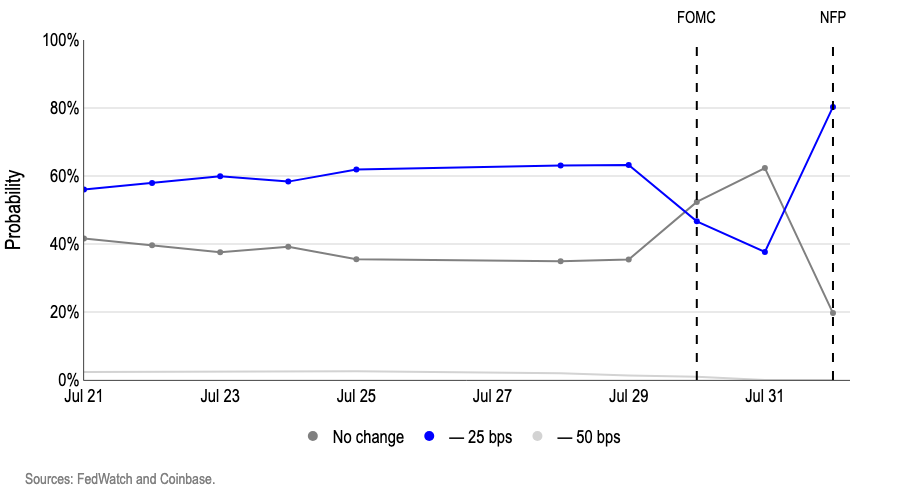
Chart 6. Both nominal and core PCE suggest sticky inflation
Implications from asset price action
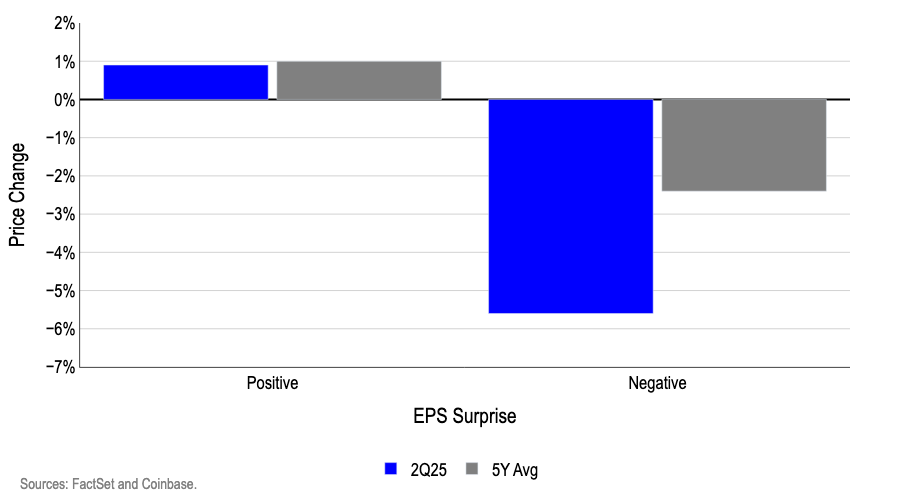
Markets have turned unforgiving—granting earnings beats a token lift while hammering misses at more than twice the normal rate—revealing a flight to quality that channels capital into tech winners and away from rate-sensitive or commodity names. In 2Q25, upside surprises have clustered in technology, communication services and financials, yet even those winners mustered little more than a 1% pop on average after reporting (Chart 7, 8). By contrast, when companies tied to commodities or higher funding costs disappointed, their share-price hits averaged roughly 6%—over twice the typical drawdown—implying investors are quick to bail at the first hint of fragility.
Chart 7. Most companies outperformed earnings expectations in Q2
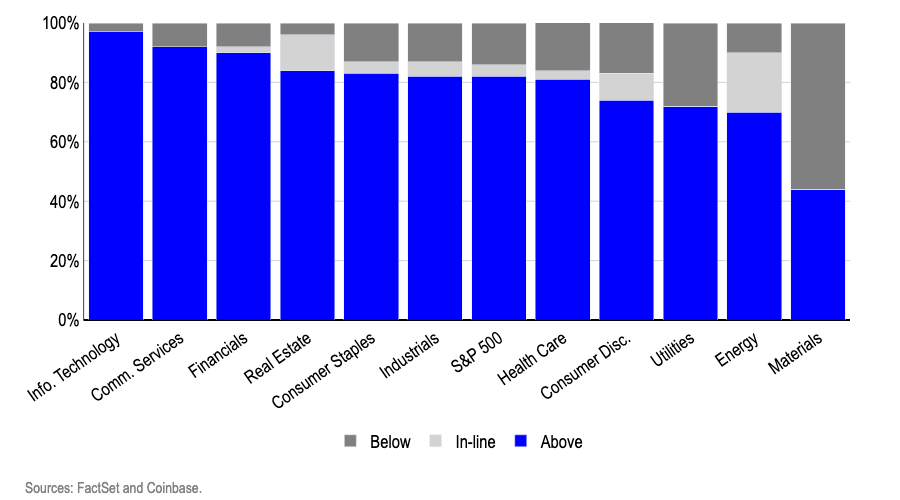
Chart 8. Market hammers Q2 misses by more than double the 5Y average while hardly rewarding beats
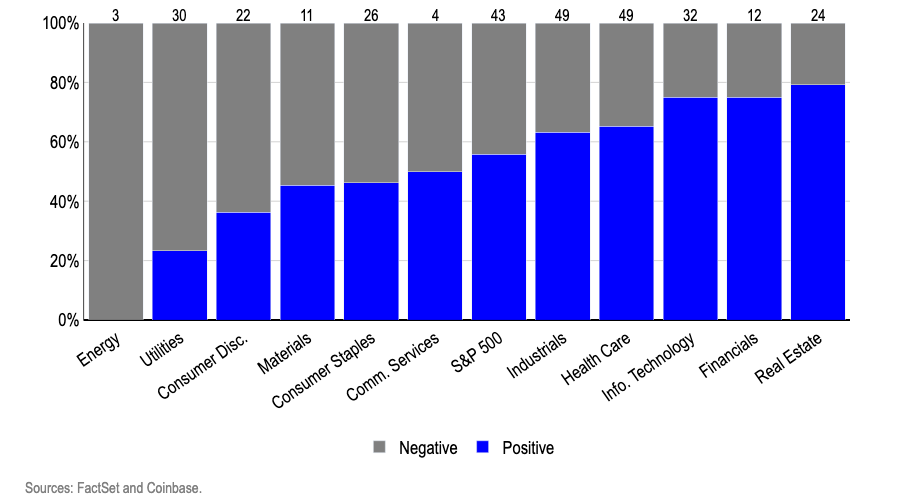
Forward-looking commentary reinforces the split: guidance from tech-adjacent and real-estate names skews constructive, whereas many energy and utility management teams struck a noticeably cautious tone (Chart 9). The point isn’t that every firm in cyclicals is struggling, but that the market is extrapolating a weaker macro backdrop—slowing payrolls, sub-50 PMI readings, sticky core PCE—and magnifying downside for any laggard in those groups. The net effect is a sharply asymmetric payoff profile: tech winners attract incremental flows, while sectors exposed to rates or raw-material volatility must clear a higher bar to secure investors’ confidence.
Chart 9. Guidance is split down the middle – half the sectors guide negatively while the other half guide positively
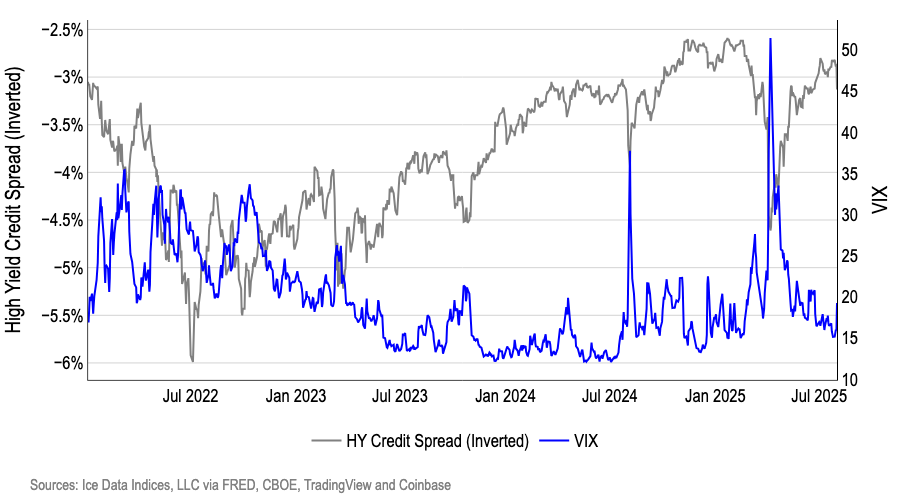
A sudden flare-up in equity volatility (VIX popping from 16 to 20) suggests a crack in risk-on sentiment, but the absence of confirmation from credit markets (high-yield option-adjusted spreads remain muted) suggests sentiment is more cautious than worried. The VIX’s 25% move implies a meaningful shift in equity risk perception, yet high yield option adjusted spreads remain perched around 3%, signaling that investors are demanding little extra premium for default risk (Chart 10). Historically, volatility spikes that aren’t echoed by spread-widening tend to fade quickly as liquidity and buy-the-dip flows reassert themselves; only when credit follows does a brief tremor morph into a broader de-risking cycle.
Put differently, equities are flashing caution while credit remains sanguine—a divergence that often resolves within a few sessions. If spreads begin to gap wider, the VIX jump could foreshadow a fuller risk-off turn. Until then, we think this warrants tighter stops and closer monitoring rather than wholesale portfolio de-risking.
Chart 10. VIX spikes but high yield option-adjusted credit spreads hardly budge
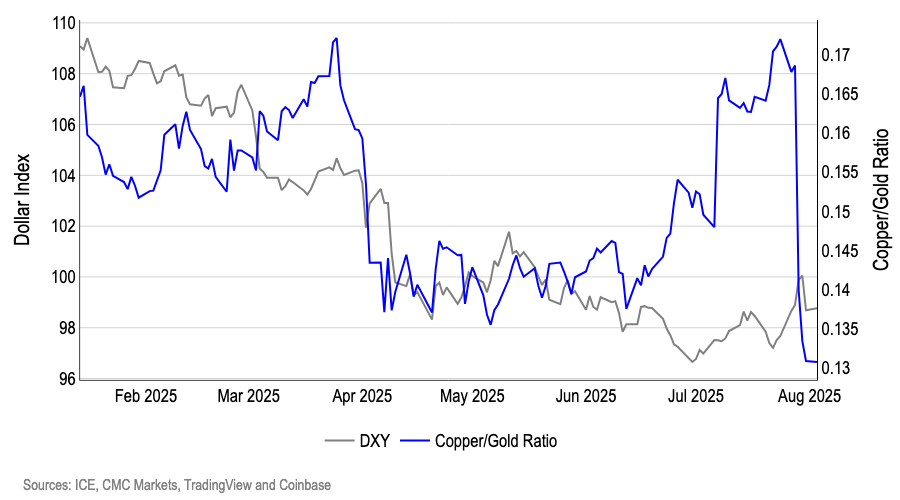
A recent dollar bid paired with an abrupt slide in the copper-to-gold ratio flags a short-term turn toward risk-off—investors are reaching for dollar liquidity while marking down the growth-sensitive copper price relative to gold’s safety premium. Over the past four weeks the DXY has risen ~2% as the copper/gold ratio tumbled from 0.17 to 0.13 within the last week (Chart 11). When investors fear tightening credit or softer global demand, they first reach for the world’s most liquid asset—the U.S. dollar—to lock in purchasing power and service dollar-denominated liabilities. Simultaneously, they lighten positions in growth-sensitive copper and shift toward gold’s collateral-like safety, driving the ratio lower.
The joint move—higher DXY, lower copper/gold—therefore reflects a single decision set: preserve liquidity, reduce cyclical beta. The contrast with early-year price action, when a softer dollar and stable-to-rising ratio underpinned a risk-on narrative, shows how quickly sentiment can pivot. However, we think the dollar spike and copper-to-gold dip look like a tactical hedge, not a regime change. Expanding global liquidity, an expansionary Fed stance, and still-tight credit spreads argue the longer-term bias for cyclicals and bitcoin remains up once the growth scare subsides.
Chart 11. The dollar catches a bid while the copper/gold ratio falls sharply
Onchain liquidity, supply, and demand
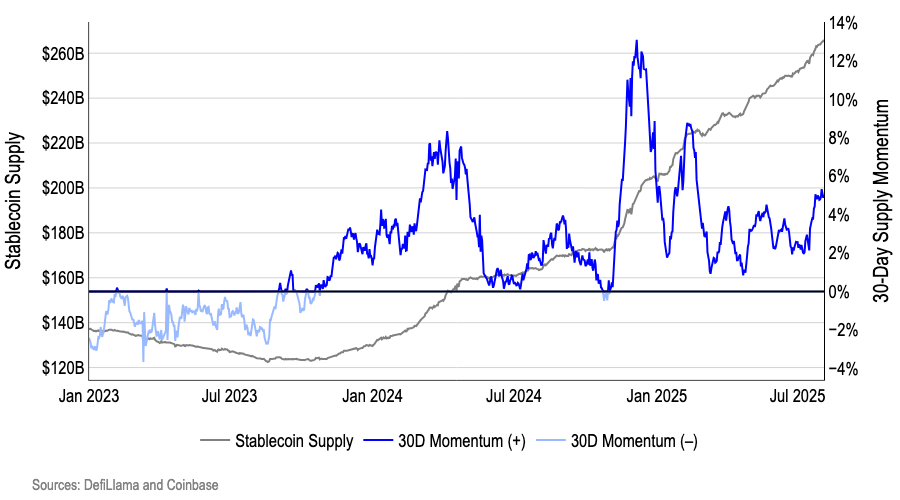
Stablecoin supply continues to grow with solid monthly momentum, signaling fresh onchain liquidity in crypto. Stablecoin circulation has risen to a record $265B, with trailing 30-day growth running at 5%—well above the zero line yet far below January’s double-digit burst (Chart 12). A growing rate of net issuance means capital is moving into, not out of, the crypto ecosystem, providing incremental buy-side firepower. The moderate pace also suggests the market isn’t in blow-off-top territory, leaving room for coins to grind higher.
Chart 12. T30D stablecoin supply momentum remains strong at 5%
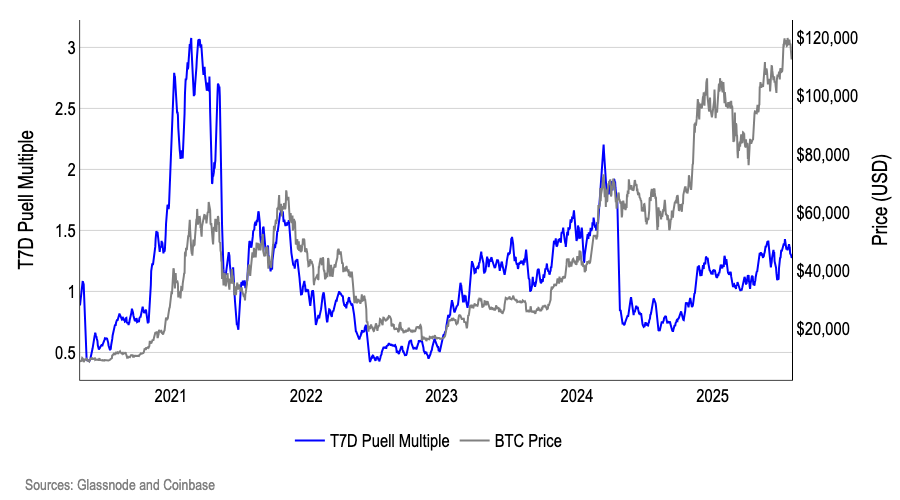
With MVRV sitting around 2.5 and the T7D Puell Multiple near 1.3, bitcoin looks profitable but not frothy—leaving room for further upside while keeping bubble risk in check. A Market-Value-to-Realized-Value (MVRV) of ~2.5 means the average coin is in the money, yet unrealized gains are smaller than the +3 spikes that preceded past blow-off tops, so broad profit-taking pressure remains relatively muted (Chart 13). Simultaneously, a Puell Multiple of 1.3 shows miners are comfortably cash-flow-positive but not earning the windfall revenues (>1.5) that typically drive aggressive inventory sales (Chart 14). In combination, the two gauges suggest neither long-term holders nor compulsory sellers are flooding the market with supply just as onchain and macro liquidity—rising stablecoin float and an expanding global M2 pulse—continue to add incremental demand.
Chart 13. MVRV Z-score vs bitcoin
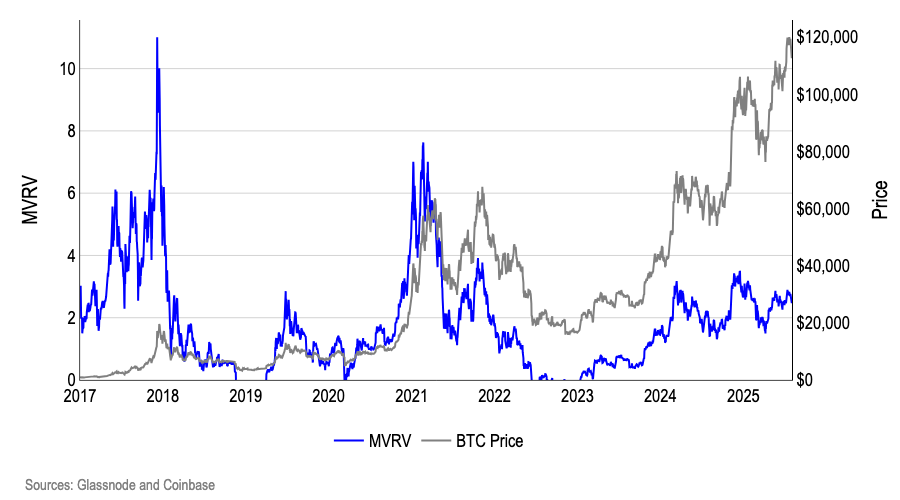
Chart 14. T7D Puell multiple vs bitcoin
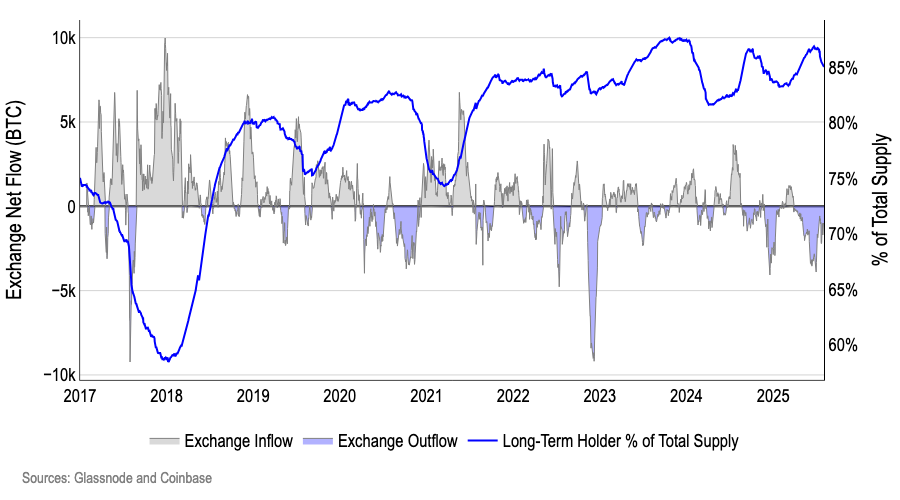
Despite the recent pullback in BTC price, long-term holders still command ~85% of all bitcoin—near a historic high—while net outflows continue to drain exchange inventories, creating an increasingly illiquid float that can magnify price moves. The share of supply held by long term holders decreased slightly in the recent pullback in prices but remains near all time highs at 85% (Chart 15). At the same time, exchanges continue to see persistent net withdrawals, pushing aggregate exchange balances ever lower and suggest less coins are migrating to trading venues for profit-taking. With fewer coins on exchanges and a record portion locked in cold storage, even modest new demand can exert outsized upward pressure on price—though the same thin liquidity could sharpen short term pullbacks if macroeconomic sentiment continues to fall.
Chart 15. Exchange net outflows persist while long term holders hold ~85% of supply.
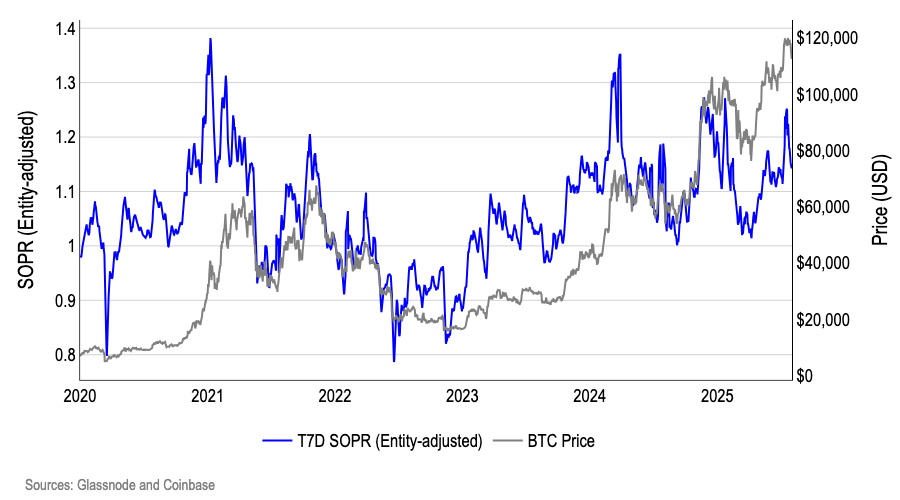
T7D SOPR sits slightly above 1, confirming that recent coin transfers are locking in moderate profits while the market still refuses to sell at a loss—behavior typical of a healthy, up-trend rather than a blow-off or capitulation. Trailing 7D Spent-Output-Profit-Ratio (SOPR) sits a touch above 1, confirming that recent coin transfers are locking in moderate profits while the market still refuses to sell at a loss – behavior typical of a healthy uptrend rather than a blow-off or capitulation (Chart 16).
SOPR tracks the realized price divided by the acquisition price of every coin spent; when the reading is greater than 1, sellers are booking gains, and when it slips below 1 they would be selling at a loss. Since early 2024 the metric has held above 1 and now hovers around 1.15, indicating investors are happy to realize some upside yet quick to step back when profits dwindle. In past bull runs, sustainable rallies showed continued support above 1 as still fundamentally bullish investors refused to sell at a loss, whereas bear markets show persistent capitulation of sellers exiting at a loss.
Chart 16. Entity-adjusted SOPR vs BTC price
Conclusion
Global liquidity and policy dynamics continue to tilt the balance toward risk-on for the long term: our custom M2 index has climbed 5% to a cycle high, and alongside a likely September rate cut, should inject fresh capital into markets even as payroll revisions, sub-50 PMI prints and tariff-driven price bumps highlight a softer growth backdrop in the short term. Q2 earnings price action highlights the current tentative risk environment—earnings beats earn only token gains while misses are punished at twice the usual rate. A fleeting VIX spike and dollar bid suggest caution rather than a full regime shift—credit spreads, stablecoin issuance and long-term onchain metrics remain broadly supportive.
In bitcoin specifically, MVRV and Puell Multiples sit in mid-to-late cycle territory, SOPR stays above one, long-term holders control 85% of supply and exchange flows remain persistently negative, all of which point to limited structural sell pressure and an illiquid float that can amplify upside once macro jitters fade. Taken together, the near-term environment warrants tactical vigilance, but the medium-term mosaic—expanding liquidity, the Fed’s expansionary bias, sticky holders and growing onchain cash—still argues that any retracements are pauses within a broader upward trend rather than the onset of a sustained risk-off phase.